前言
什么是 Prometheus、Node Exporter 和 Grafana?它们是用于监控和可视化系统性能的工具。
- Prometheus 是一个开源的监控系统和时间序列数据库
- Node Exporter 是 Prometheus 的一个组件,用于收集 Linux 系统的硬件和操作系统指标
- Grafana 是一个开源的数据可视化平台,可以与 Prometheus 集成来展示数据
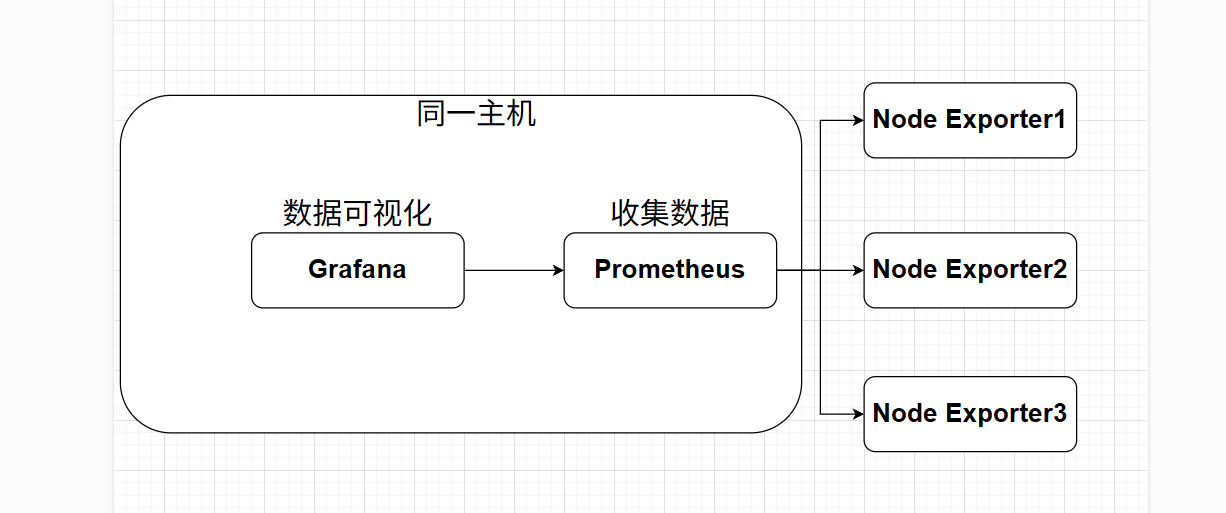
关于数据流动,Prometheus 通过 HTTP 拉取 Node Exporter 的指标数据,然后将这些数据存储在时间序列数据库中。Grafana 则通过查询 Prometheus 的 API 来获取这些数据,并以可视化的方式展示出来。
所以 Prometheus 需要能访问 Node Exporter 的 HTTP 接口,而 Grafana 则需要能访问 Prometheus 的 HTTP 接口。
在实践中,我们将把 Prometheus 和 Grafana 部署在同一台服务器上。Node Exporter 将安装在所需要监控的服务器上。
为什么不用 docker ?个人觉得为了 docker 那点便利性不值得,并且 docker 至今还不原生支持 nftables,直接在宿主机上部署更少问题。
架构示意图
环境
Debian 12
安装 Prometheus
使用我的脚本
如果你不想手动安装,可以使用我写的脚本来自动化安装 Prometheus。
bash <(curl -s https://raw.githubusercontent.com/TnZzZHlp/CommonScript/refs/heads/main/Scripts/IU_Prometheus.sh)
手动安装
下载 Prometheus 的二进制文件
查看 Github Releases 页面,下载最新版本的 Prometheus 二进制文件。
 curl -OL https://github.com/prometheus/prometheus/releases/download/v3.4.1/prometheus-3.4.1.linux-amd64.tar.gz

 tar -xvf prometheus-3.4.1.linux-amd64.tar.gz
 cp prometheus-3.4.1.linux-amd64/prometheus /usr/local/bin/
创建 Prometheus 的配置文件
mkdir /etc/prometheus
cp prometheus-3.4.1.linux-amd64/prometheus.yml /etc/prometheus/
创建 Systemd 服务文件
cat <<EOF >/etc/systemd/system/prometheus.service
[Unit]
Description=Prometheus Service
After=network.target

[Service]
User=root
Group=root
ExecStart=/usr/local/bin/prometheus --config.file=/etc/prometheus/prometheus.yml

[Install]
WantedBy=multi-user.target
EOF
启动 Prometheus 服务
systemctl start prometheus
systemctl enable prometheus
验证 Prometheus 是否正常运行 打开浏览器访问
http://<your-server-ip>:9090,如果看到 Prometheus 的界面说明安装成功。清除下载的文件
rm -rf prometheus-3.4.1.linux-amd64.tar.gz prometheus-3.4.1.linux-amd64
安装 Node Exporter
使用我的脚本
如果你不想手动安装,可以使用我写的脚本来自动化安装 Node Exporter。
bash <(curl -s https://raw.githubusercontent.com/TnZzZHlp/CommonScript/refs/heads/main/Scripts/IU_NodeExporter.sh)
手动安装
下载 Node Exporter 的二进制文件
查看 Github Releases 页面,下载最新版本的 Node Exporter 二进制文件。
curl -OL https://github.com/prometheus/node_exporter/releases/download/v1.9.1/node_exporter-1.9.1.linux-amd64.tar.gz

tar -xvf node_exporter-1.9.1.linux-amd64.tar.gz
cp node_exporter-1.9.1.linux-amd64/node_exporter /usr/local/bin/
创建 Systemd 服务文件
cat <<EOF >/etc/systemd/system/node_exporter.service
[Unit]
Description=Node Exporter Service
After=network.target

[Service]
User=root
Group=root
ExecStart=/usr/local/bin/node_exporter

[Install]
WantedBy=multi-user.target
EOF
启动 Node Exporter 服务
systemctl start node_exporter
systemctl enable node_exporter
验证 Node Exporter 是否正常运行 打开浏览器访问
http://<your-server-ip>:9100/metrics,如果看到 Node Exporter 的指标数据说明安装成功。清除下载的文件
rm -rf node_exporter-1.9.1.linux-amd64.tar.gz node_exporter-1.9.1.linux-amd64
配置 Prometheus 数据源
用你喜欢的命令行编辑器, 例如 nano 打开 /etc/prometheus/prometheus.yml
nano /etc/prometheus/prometheus.yml配置 Prometheus 数据源
参考下面的配置:
global:
    scrape_interval: 15s # Set the scrape interval to every 15 seconds. Default is every 1 minute.
    evaluation_interval: 15s # Evaluate rules every 15 seconds. The default is every 1 minute.
    # scrape_timeout is set to the global default (10s).

# Alertmanager configuration

alerting:
    alertmanagers:
        - static_configs:
            - targets:
                # - alertmanager:9093

# Load rules once and periodically evaluate them according to the global 'evaluation_interval'

rule_files:
    # - "first_rules.yml"
    # - "second_rules.yml"

# A scrape configuration containing exactly one endpoint to scrape

# Here it's Prometheus itself

scrape_configs:
    # The job name is added as a label `job=<job_name>` to any timeseries scraped from this config.
    - job_name: "prometheus"

    # metrics_path defaults to '/metrics'
    # scheme defaults to 'http'.

      static_configs:
        - targets: ["localhost:9090"]
            # The label name is added as a label `label_name=<label_value>` to any timeseries scraped from this config.
            labels:
                app: "prometheus"
    - job_name: "node-exporter"
      static_configs:
        - targets: ["localhost:9100"]
            labels:
                instance: "Home-Leveo"
        - targets: ["192.168.2.1:9100"]
            labels:
                instance: "Home-Route"
        - targets: ["192.168.255.152:9100"]
            labels:
                instance: "DMIT-LA-CMIN2"
        - targets: ["192.168.255.201:9100"]
            labels:
                instance: "Tencent-GZ"
        - targets: ["192.168.255.193:9100"]
            labels:
                instance: "Huawei-HK"
        - targets: ["192.168.255.176:9100"]
            labels:
                instance: "DMIT-LA-GIA"
scrape_configs:
- job_name: “node-exporter” 是配置 Node Exporter 的抓取任务。
- static_configs: 是配置抓取目标的静态列表。
确保目标地址本机都能访问到。
重启 Prometheus 服务
systemctl restart prometheus打开 Prometheus 的 Web 界面
打开浏览器访问
http://<your-server-ip>:9090,在 “Status” -> “Targets” 页面可以看到 Node Exporter 的抓取目标。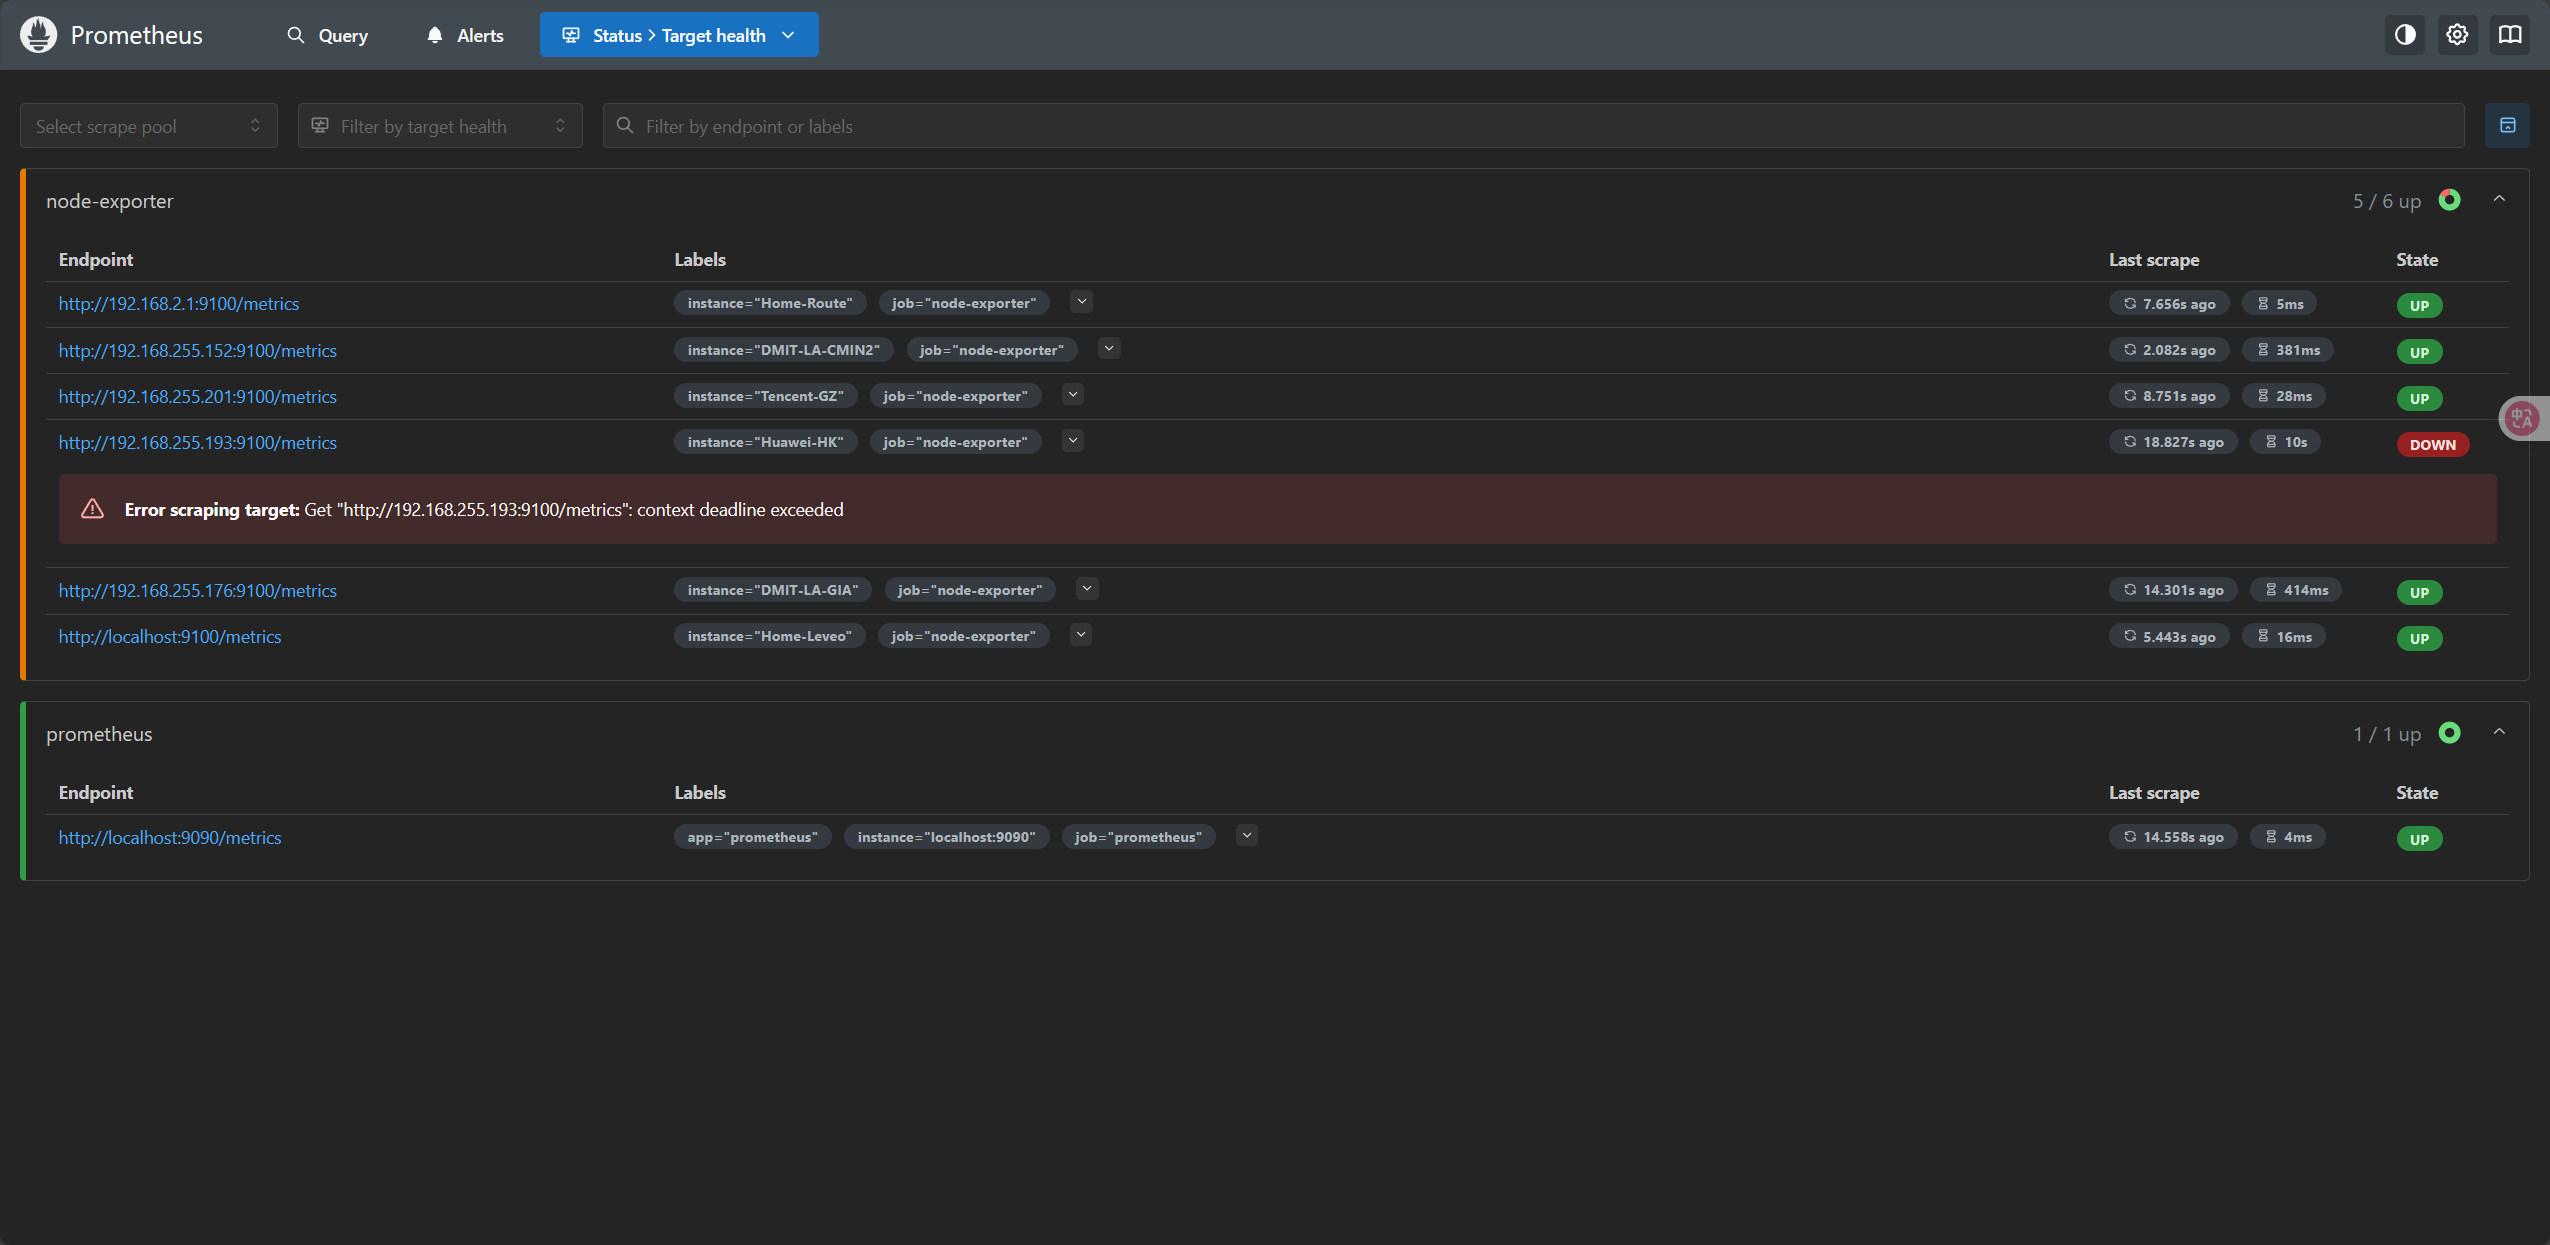
安装 Grafana
sudo apt-get install -y adduser libfontconfig1 musl
wget https://dl.grafana.com/oss/release/grafana_12.0.2_amd64.deb
sudo dpkg -i grafana_12.0.2_amd64.deb
启动 Grafana
systemctl start grafana-server
systemctl enable grafana-server
配置 Grafana 数据源
- 打开浏览器访问
http://<your-server-ip>:3000,默认用户名和密码都是admin。 - 登录后,点击左侧菜单的 “Configuration” -> “Data Sources”。
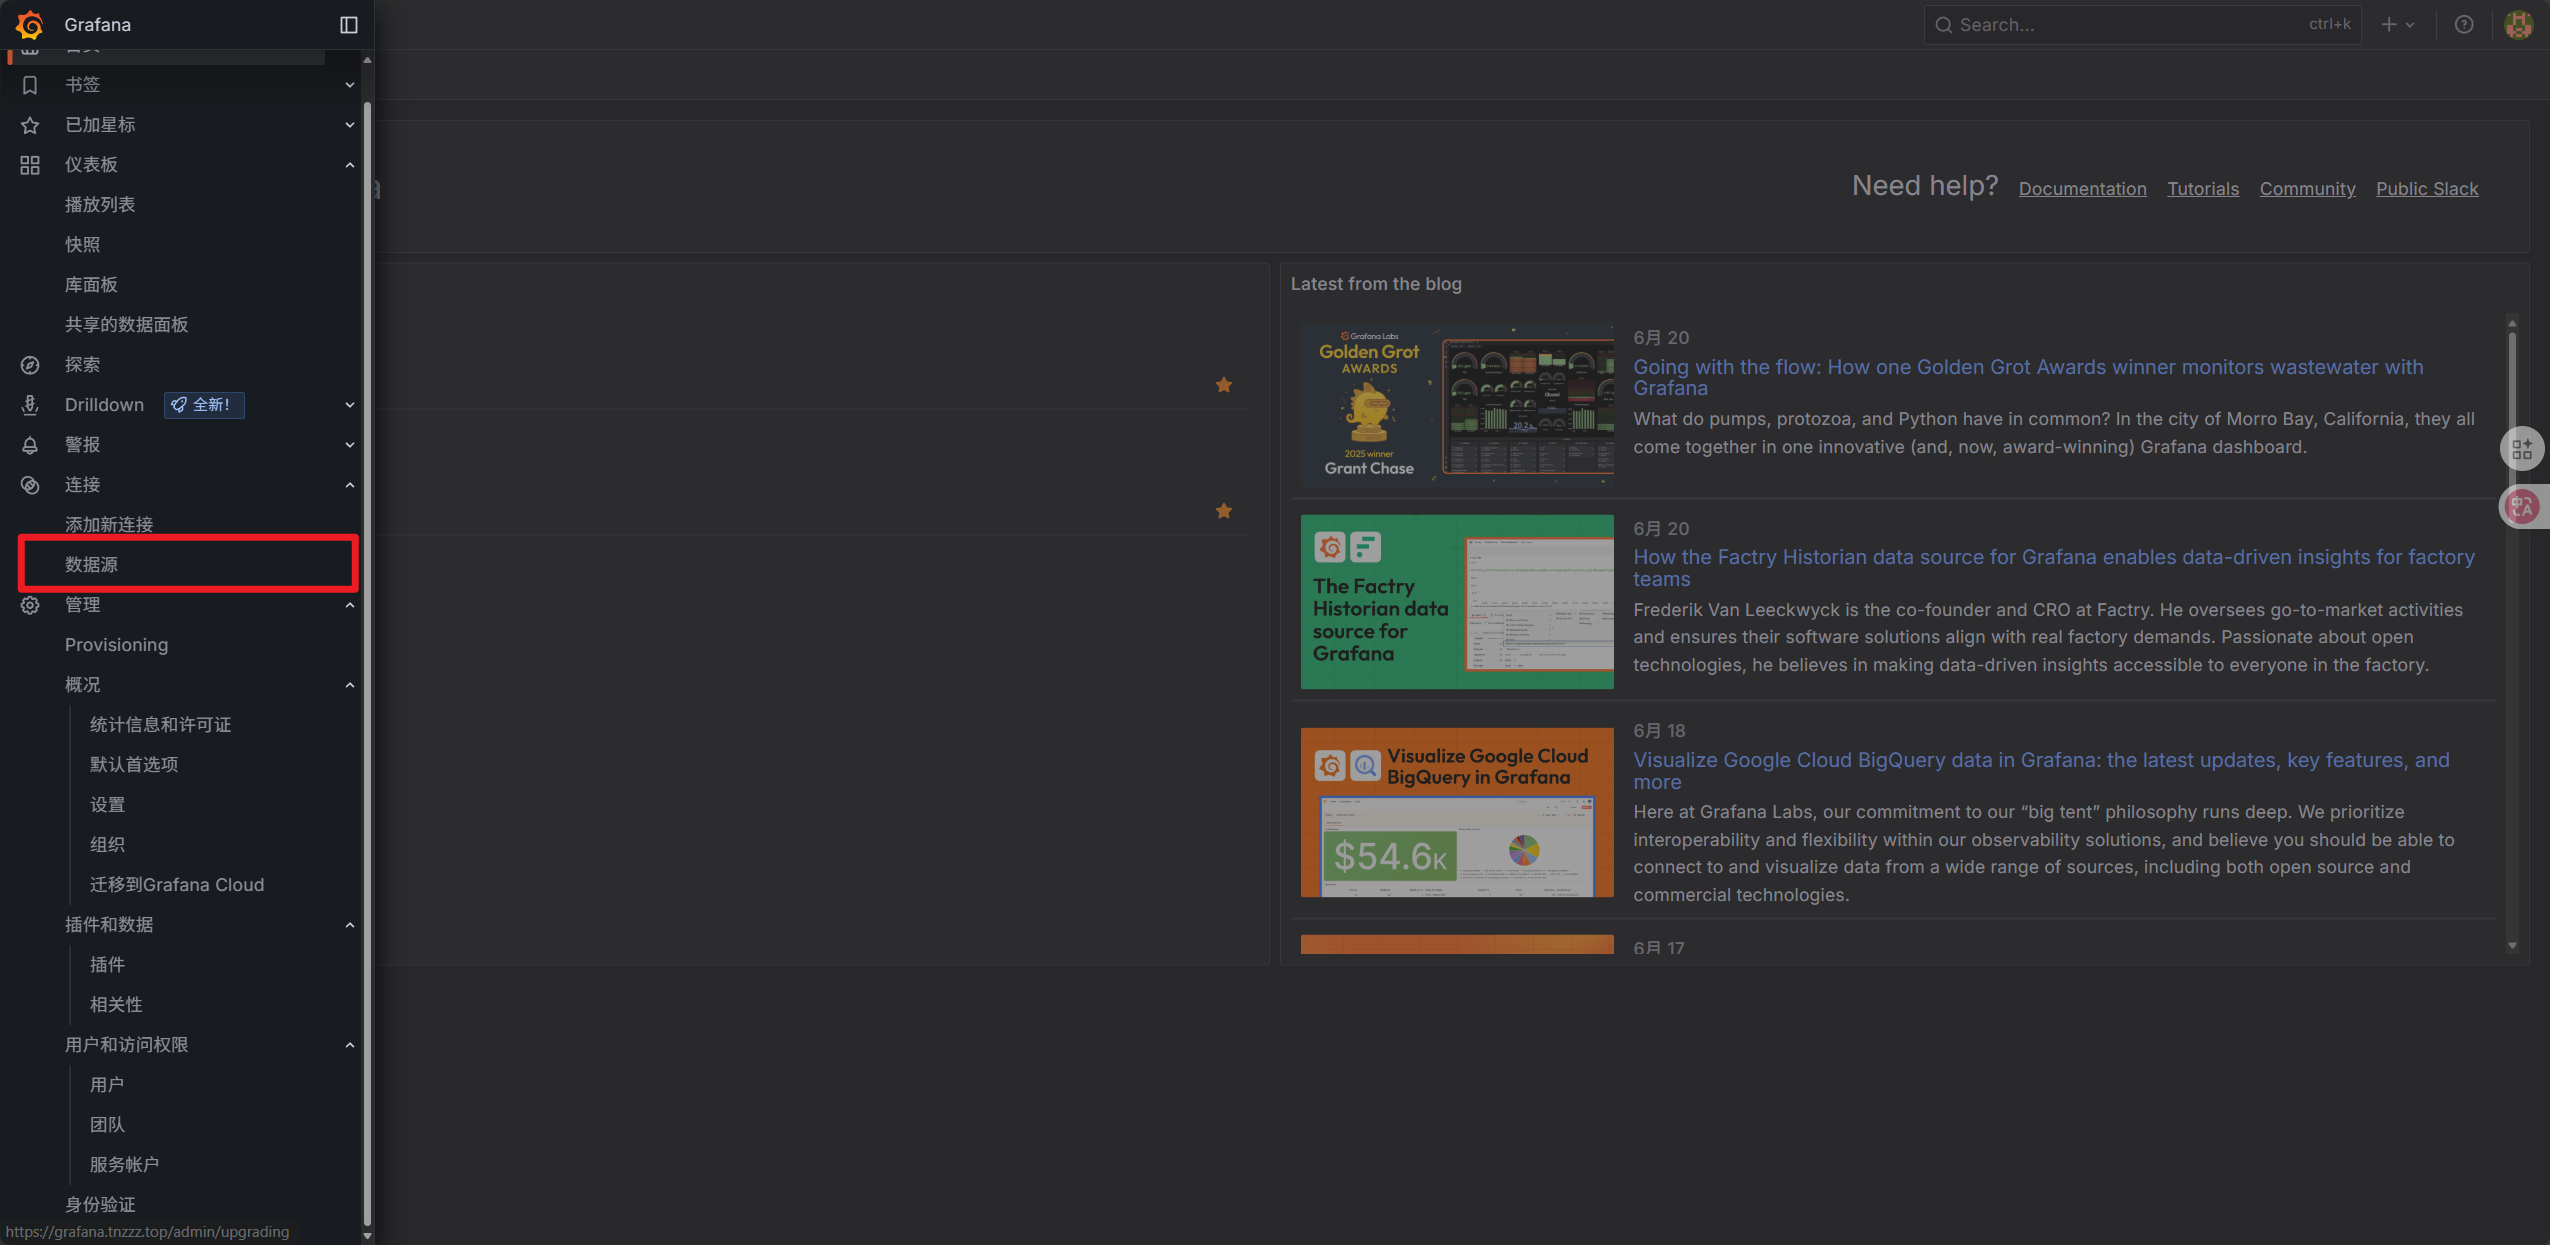
- 点击 “Add data source”,选择 “Prometheus”。
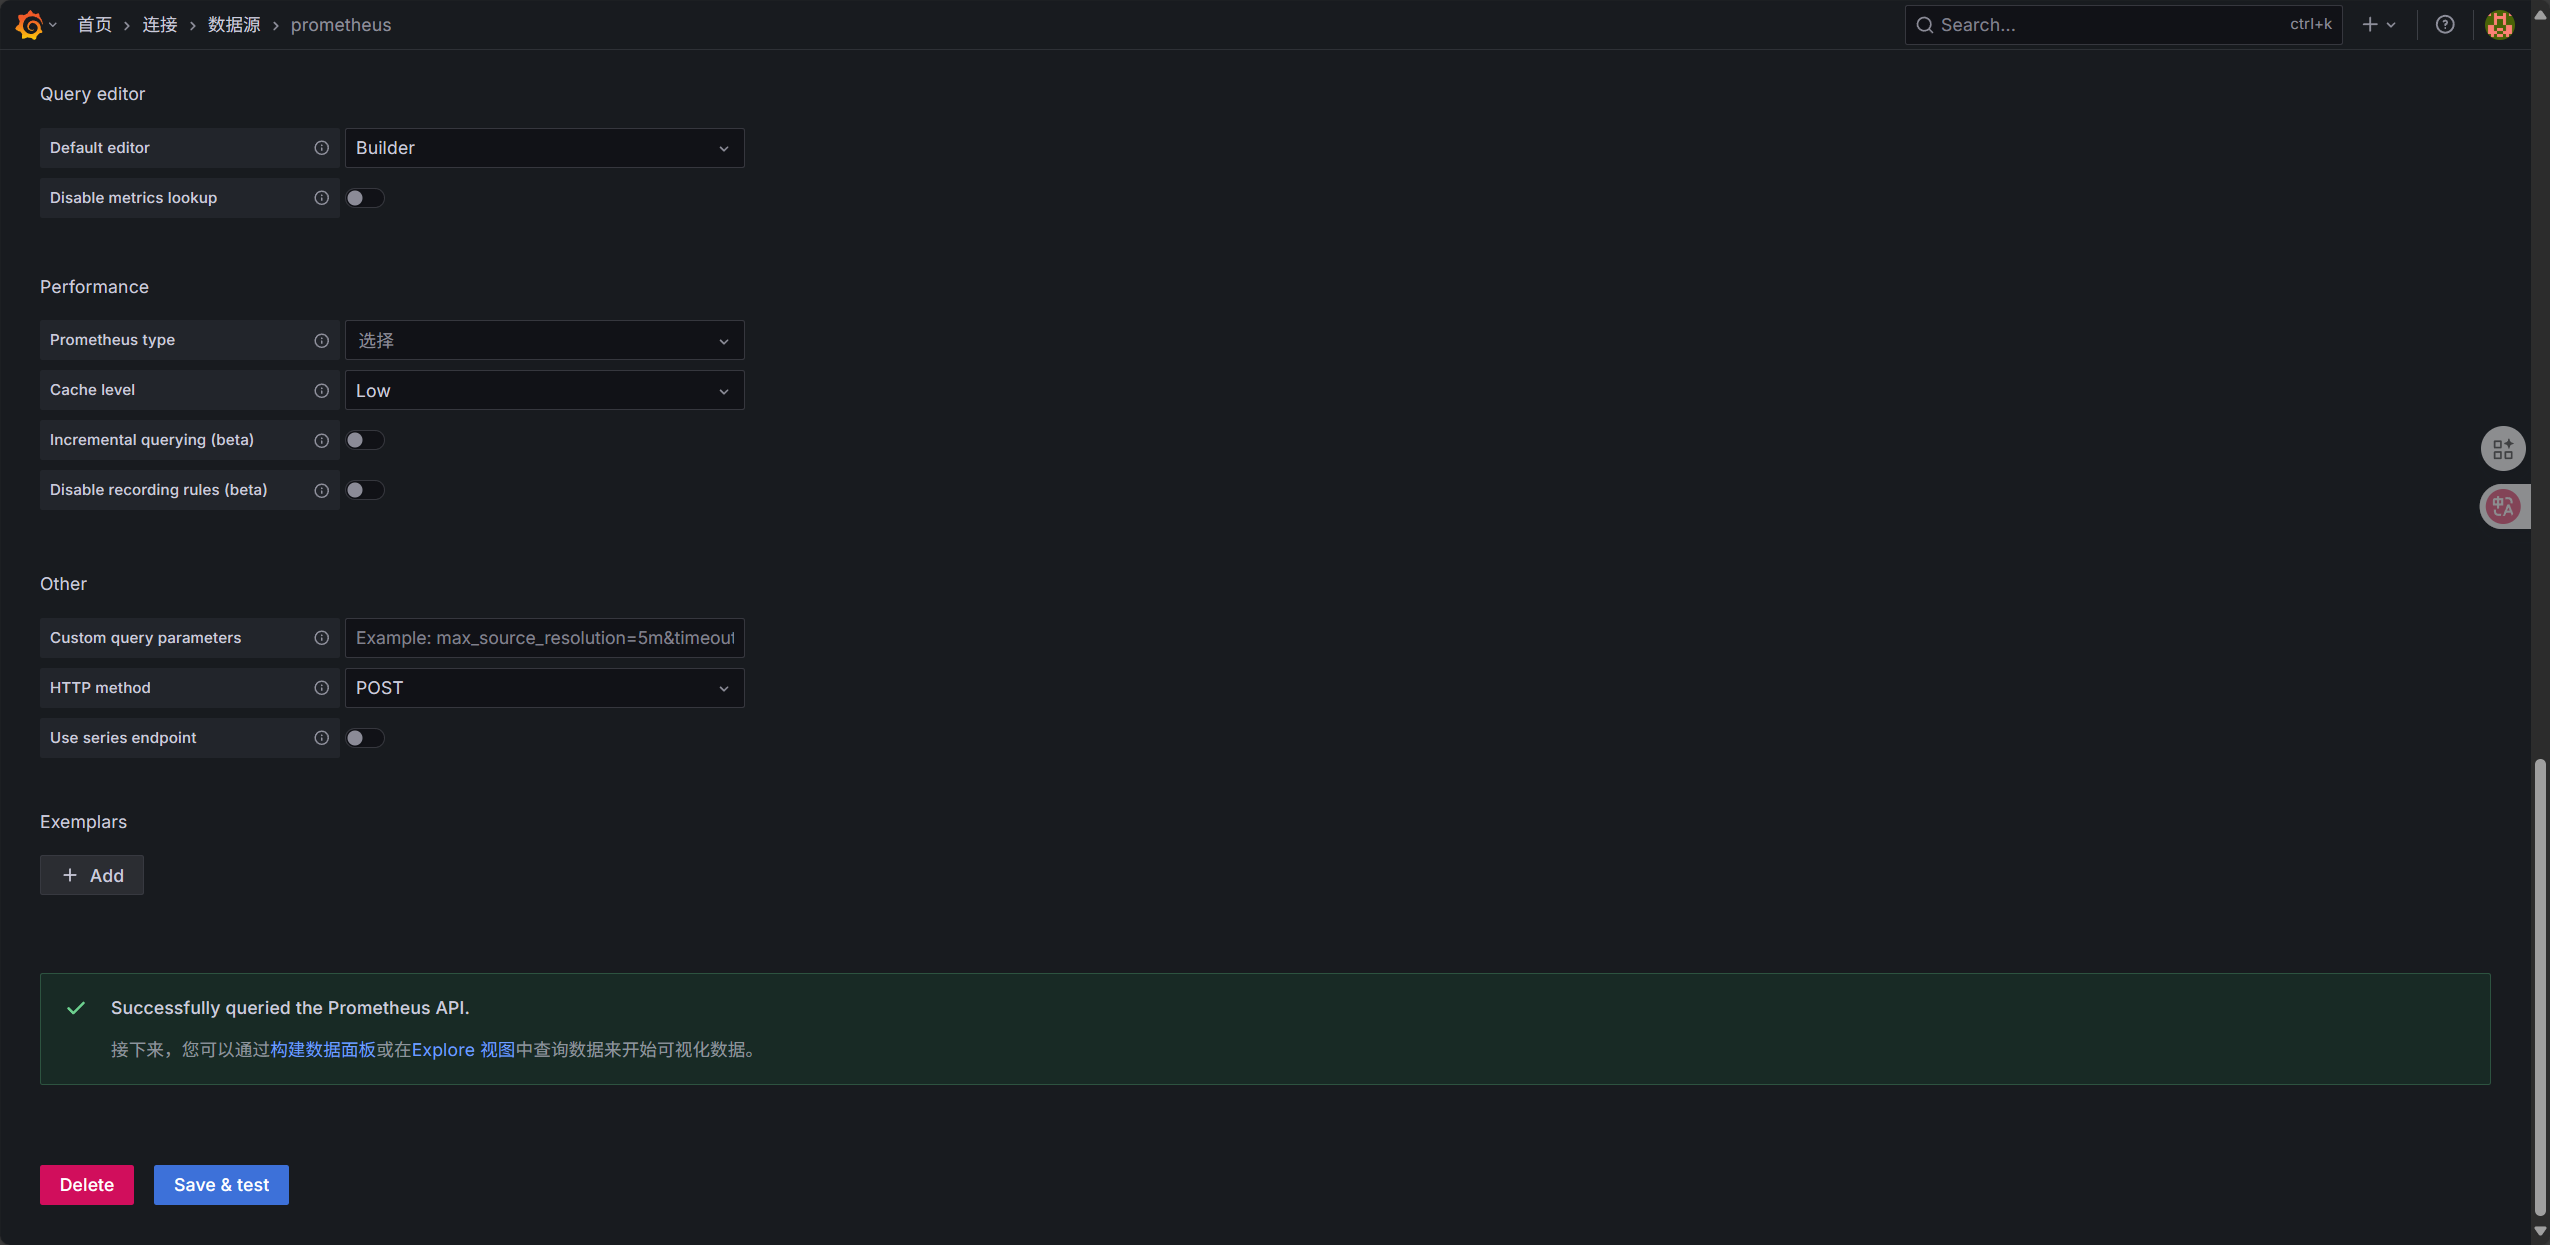
- 在 “HTTP” 部分,设置 URL 为
http://<your-server-ip>:9090。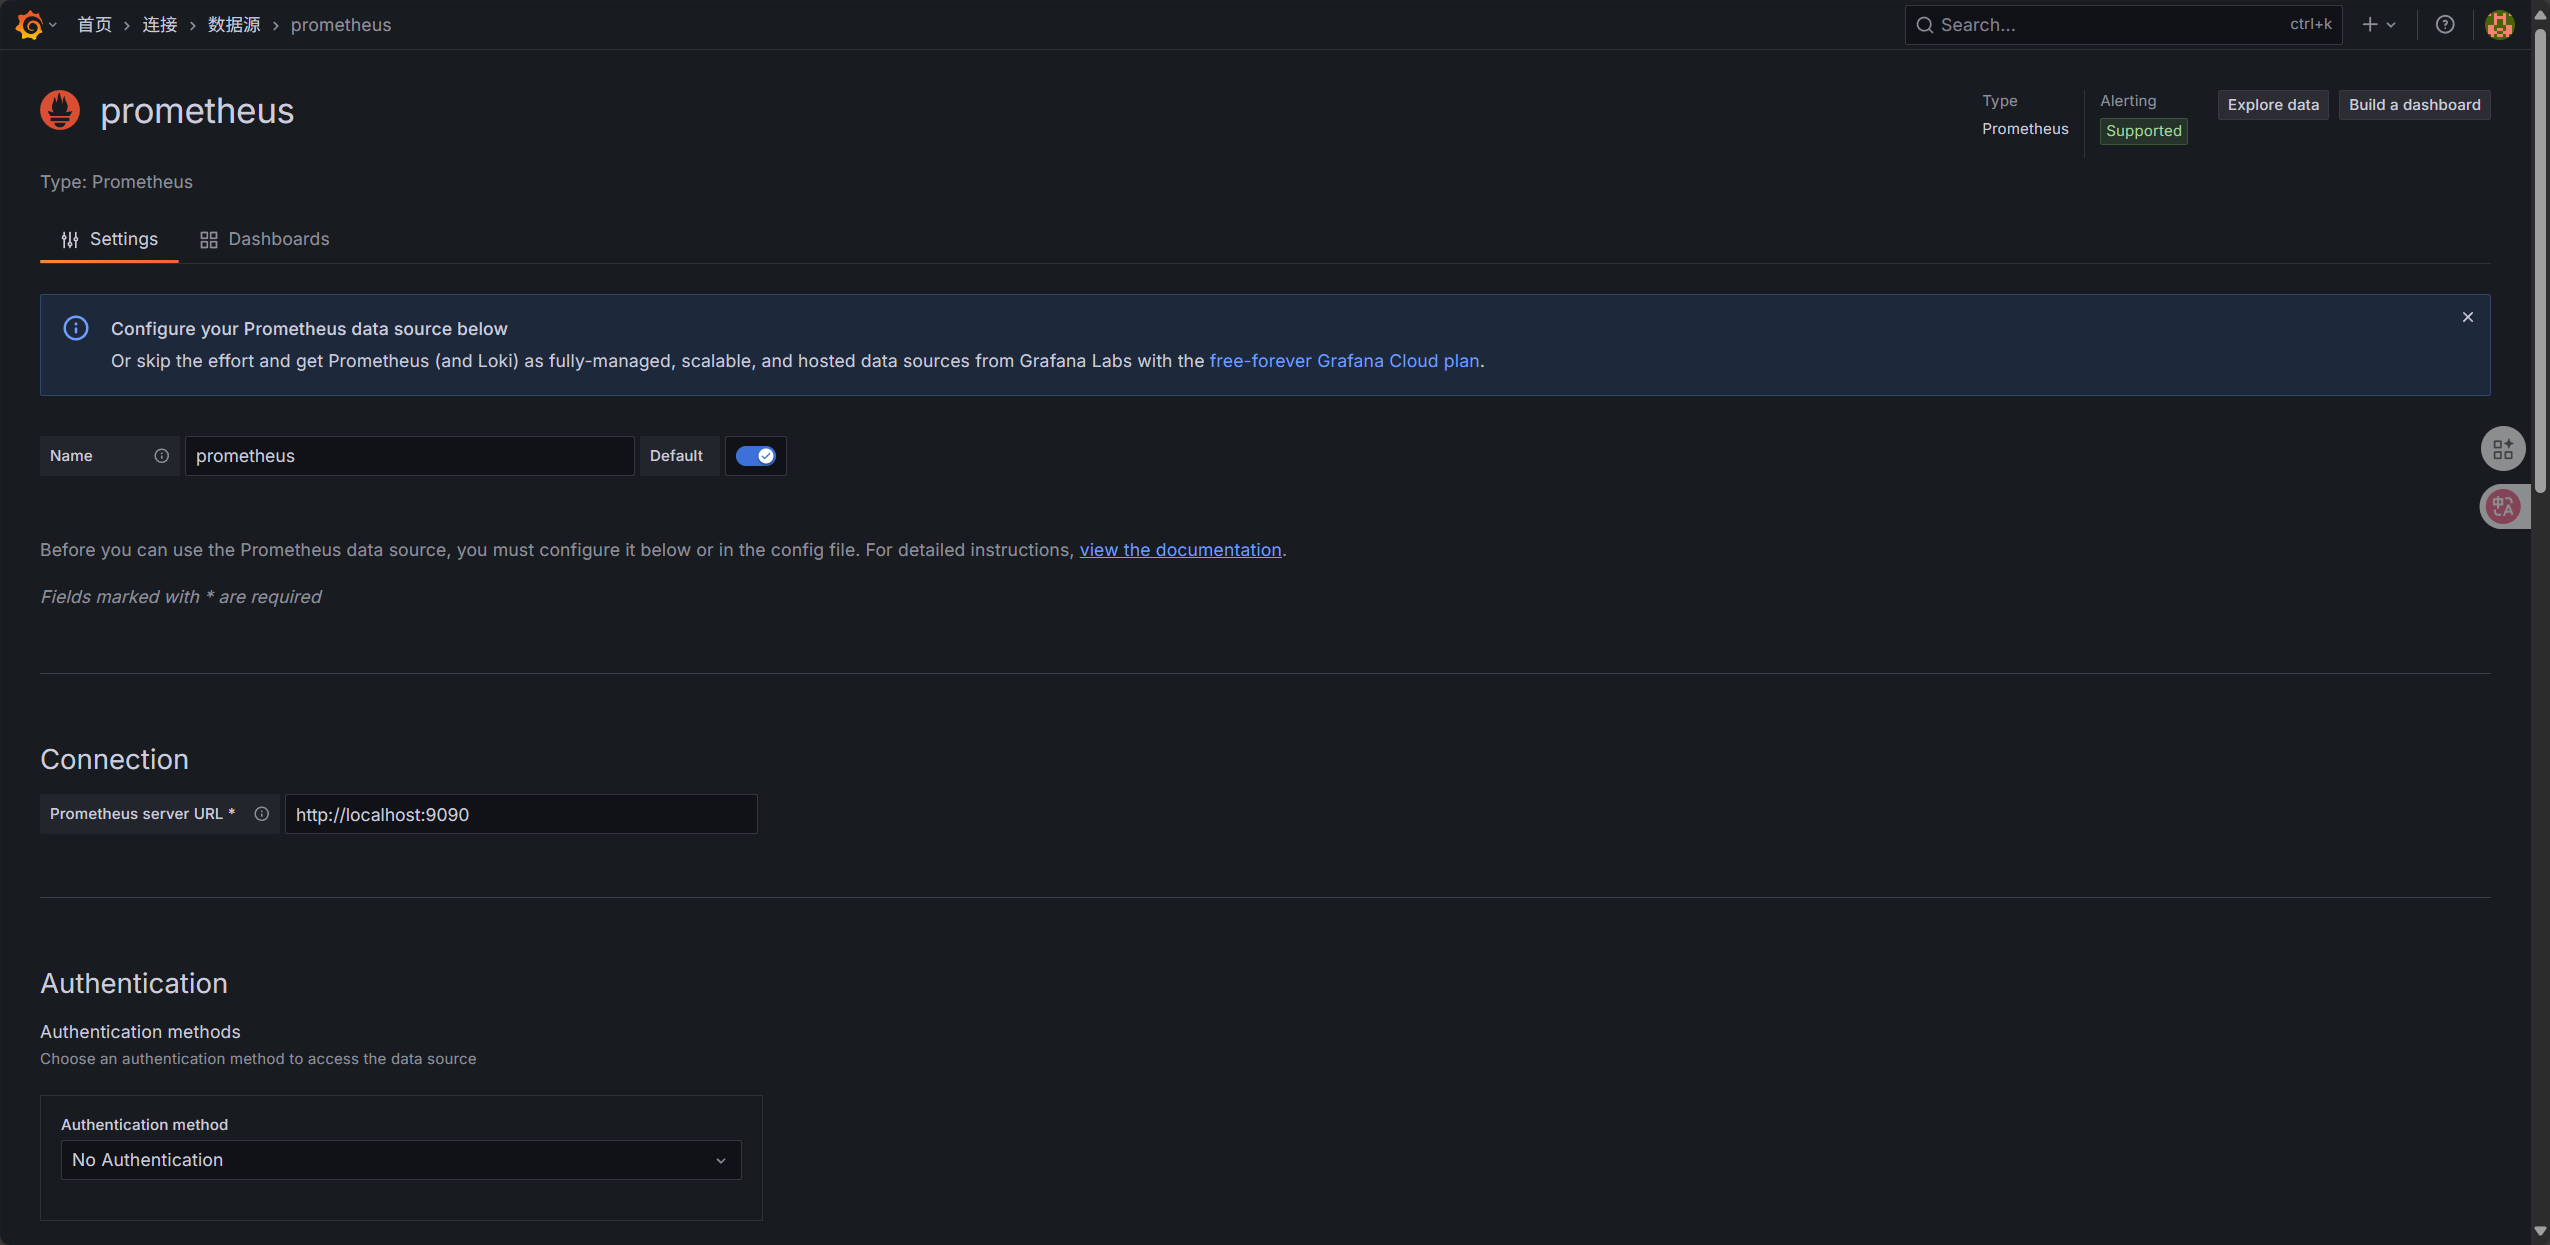
- 点击 “Save & Test”,如果一切正常,你应该会看到 “Data source is working” 的提示。
创建仪表板
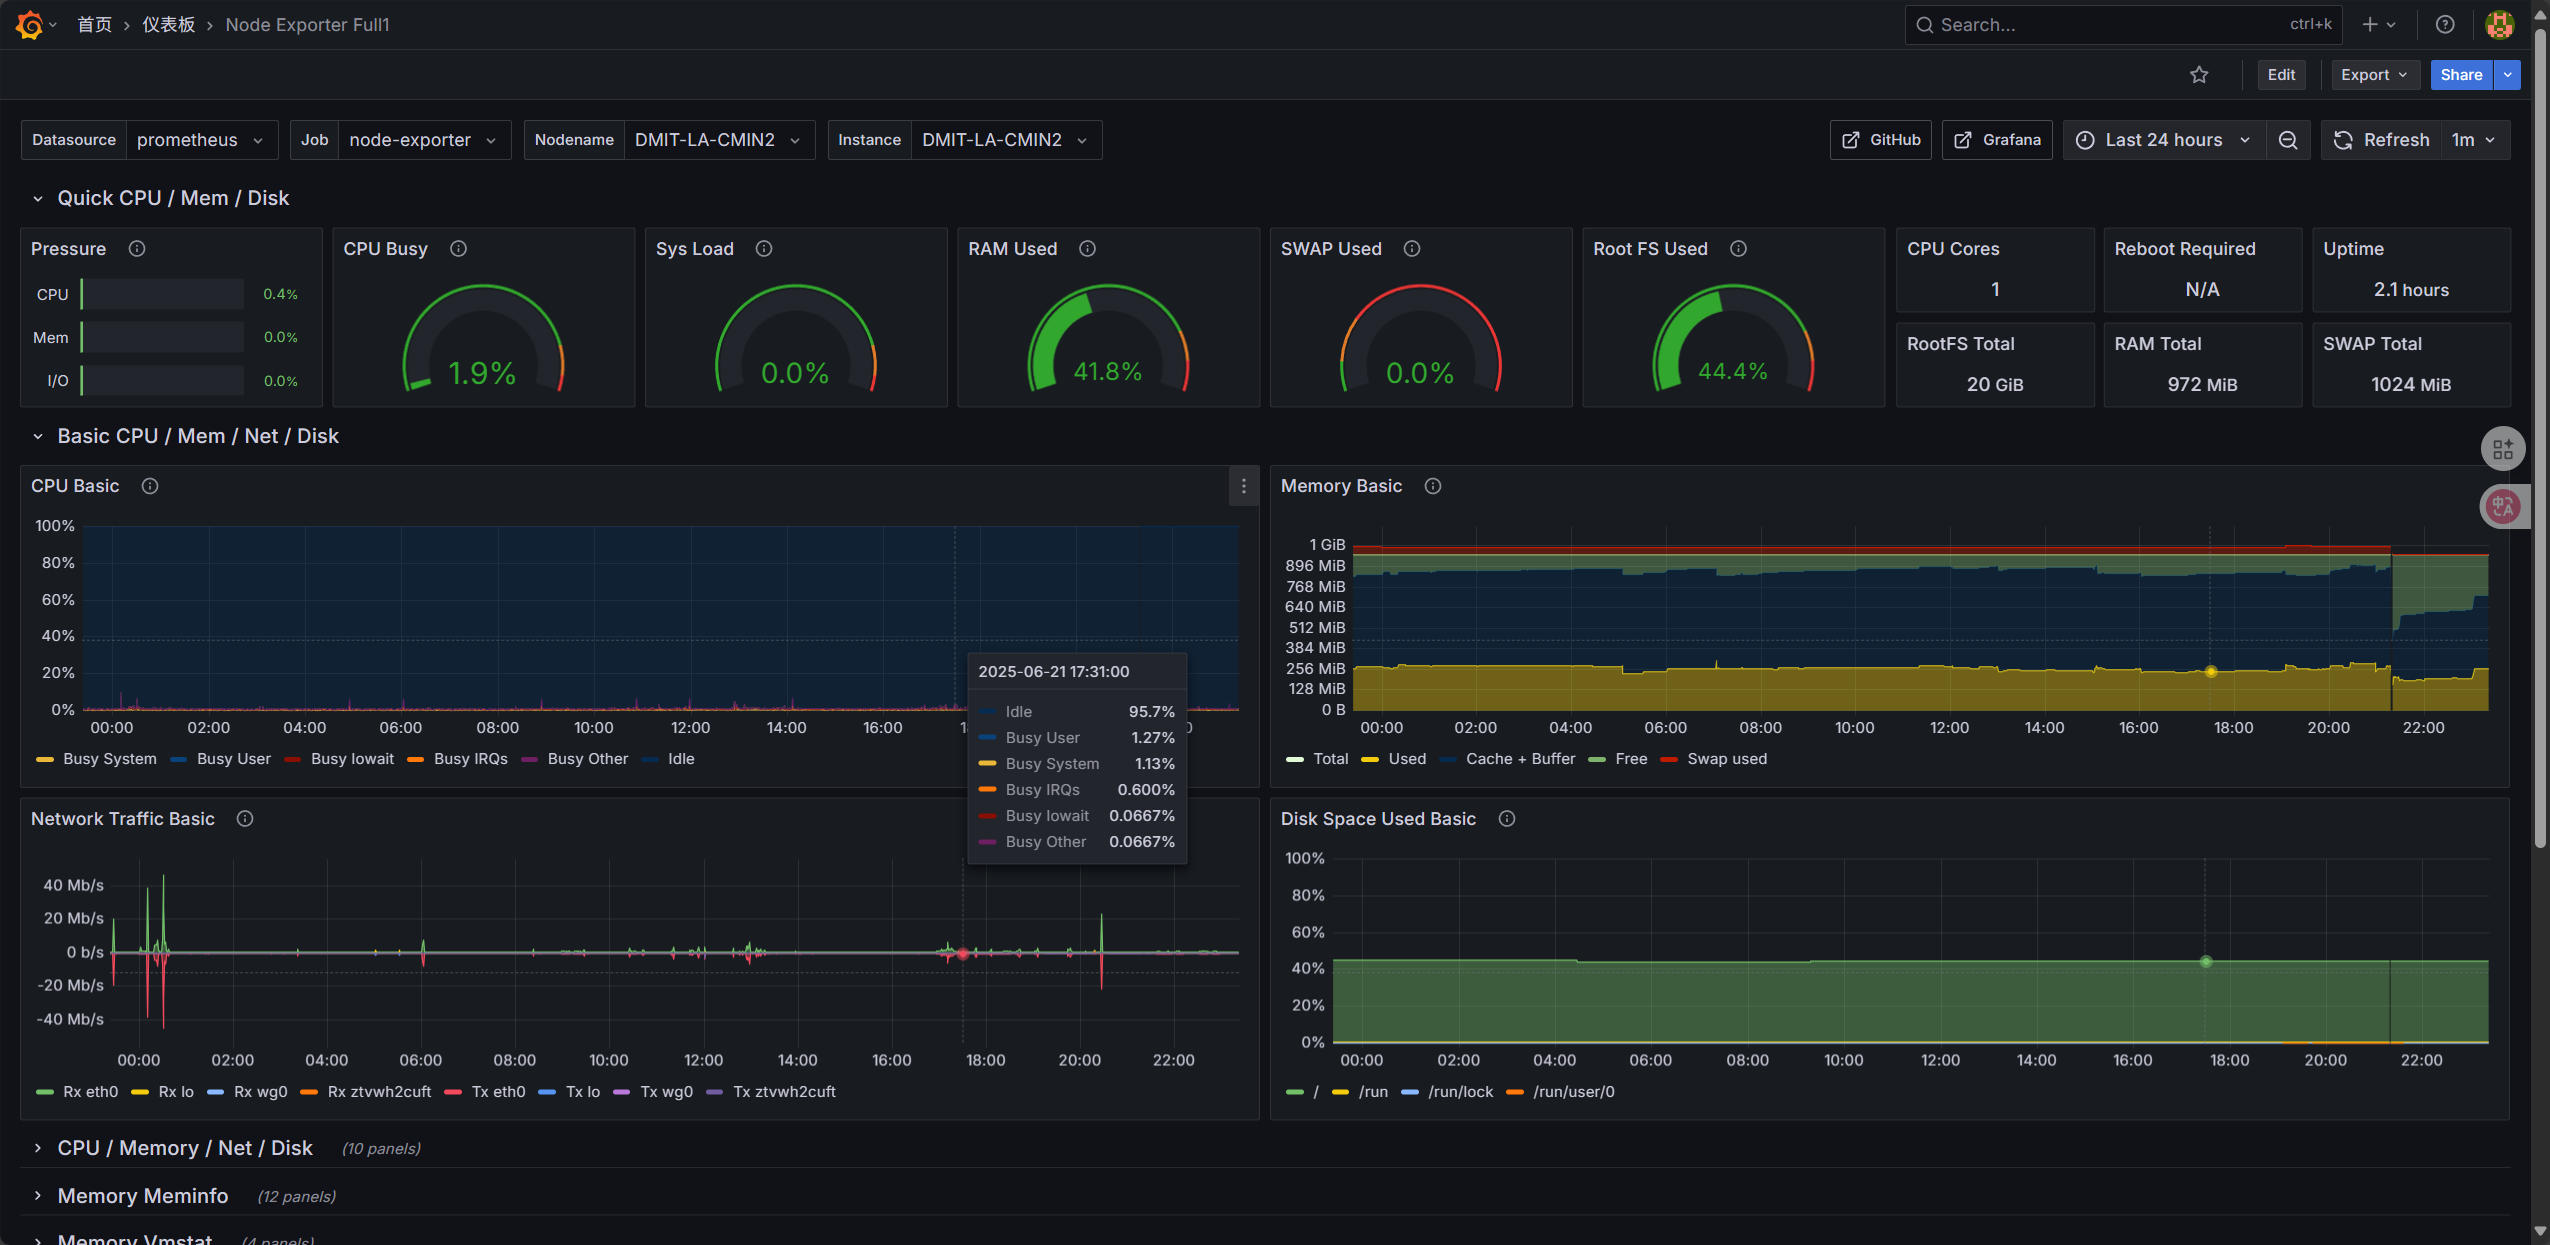
这个网上有很多现成模板,我用的是 Node Exporter Full 仪表板。
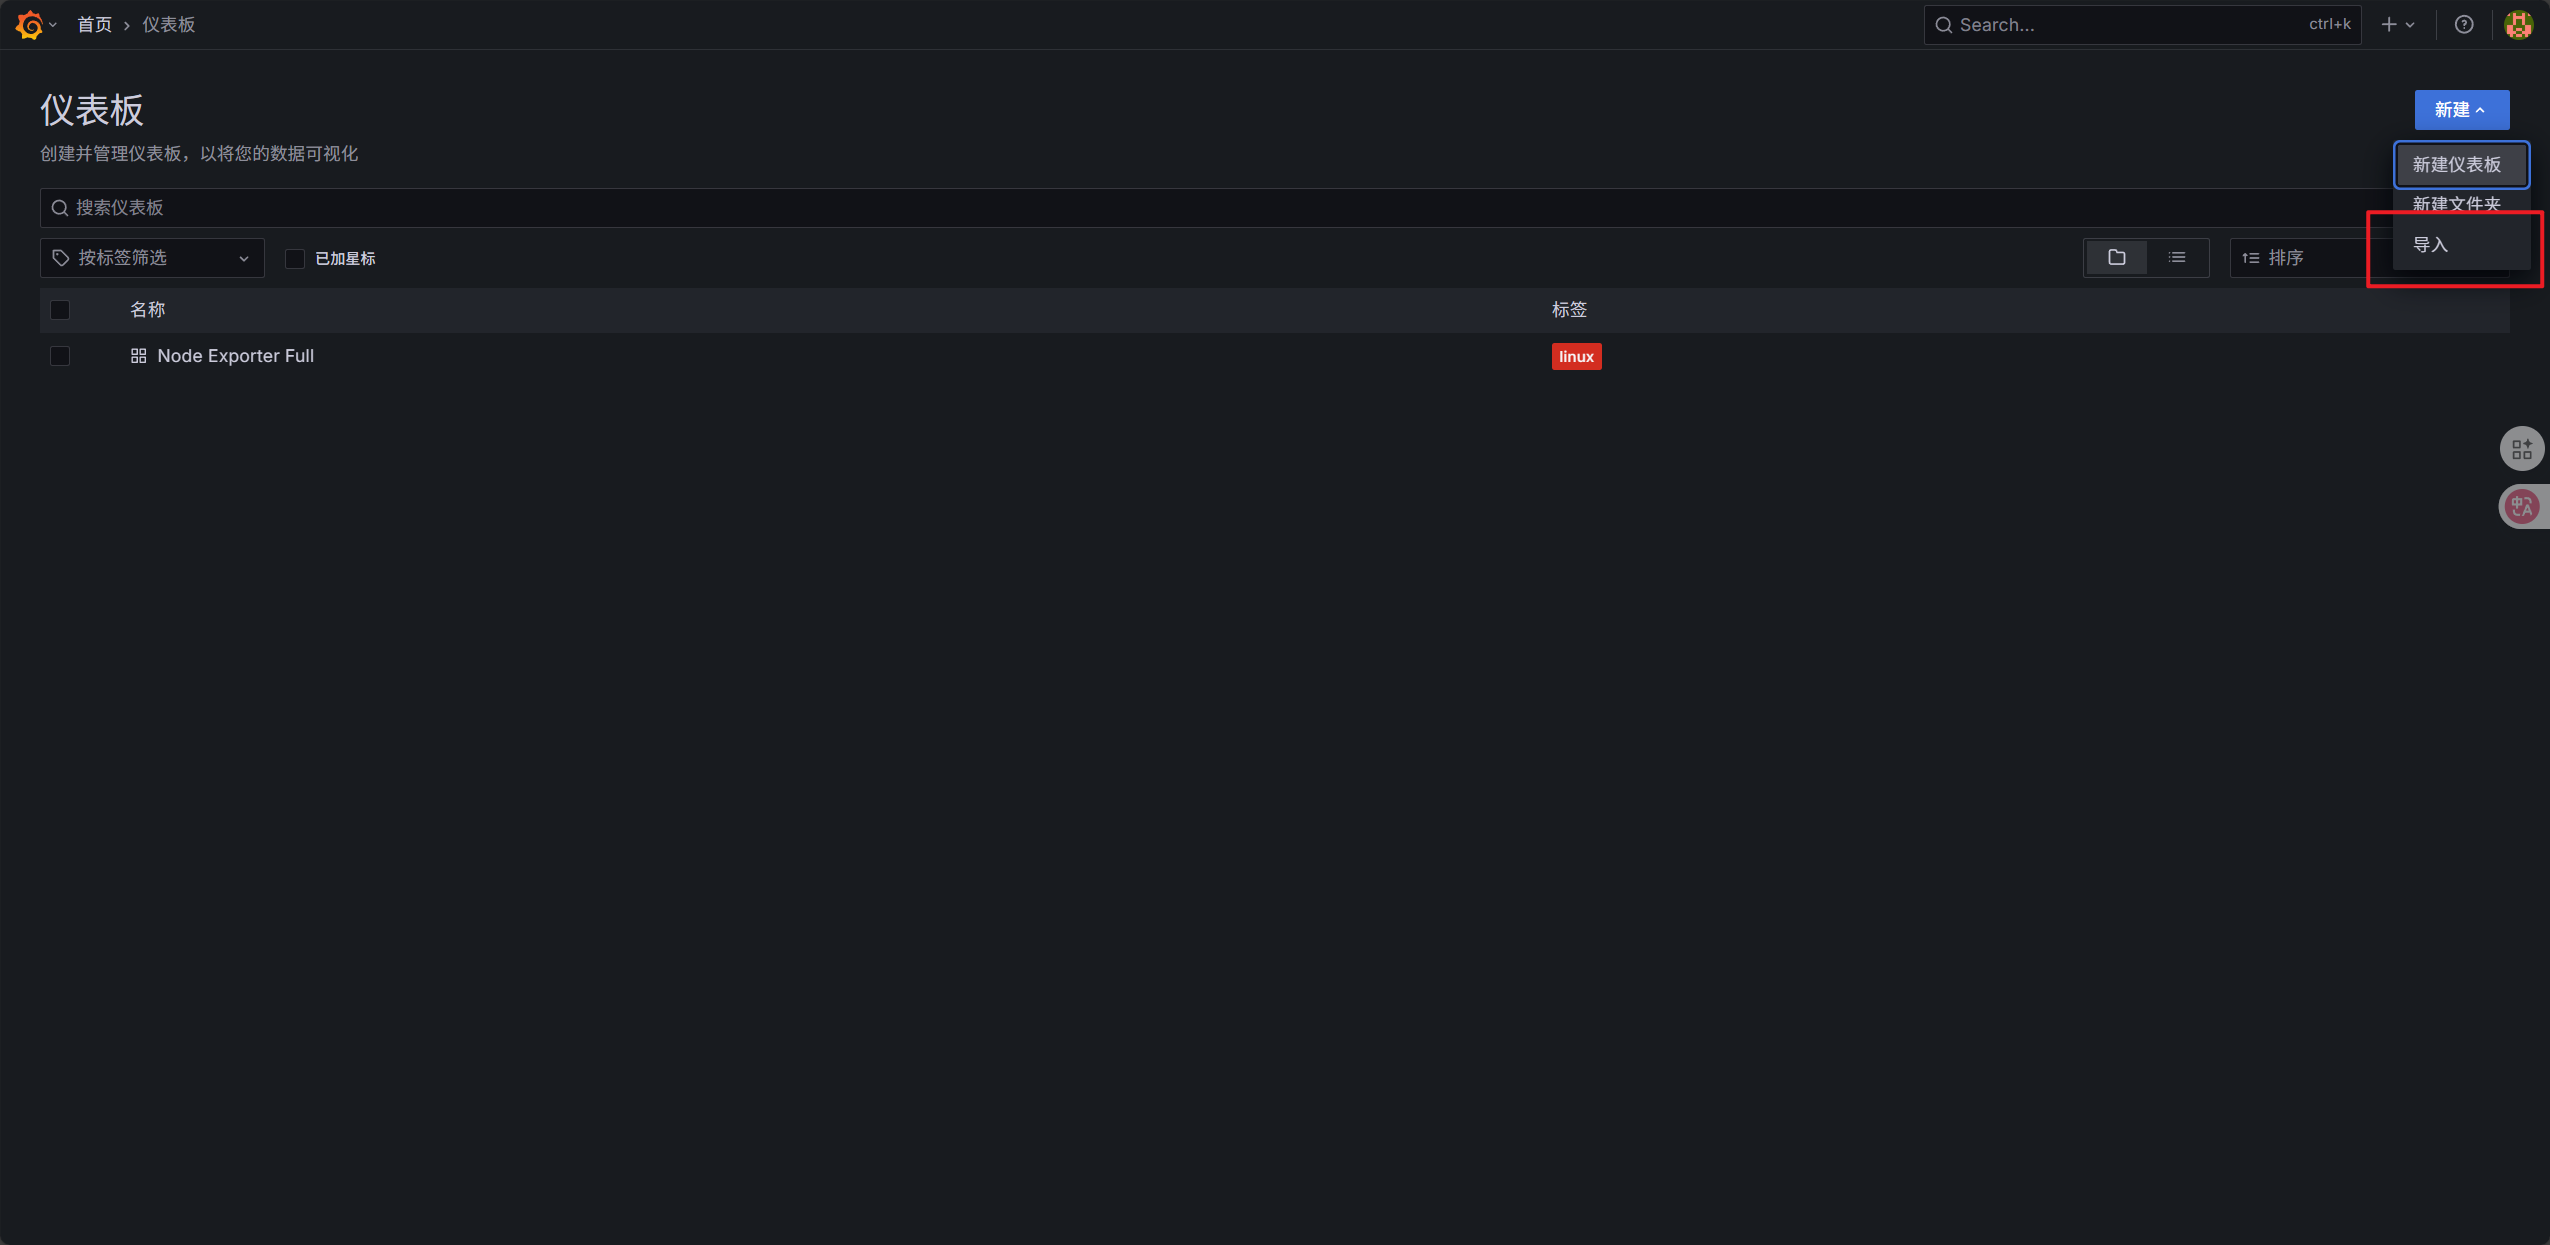
- 在 Grafana 的左侧菜单中,点击 “Create” -> “Import”。
- 在 “Import via grafana.com” 输入框中,输入仪表板 ID
1860,然后点击 “Load”。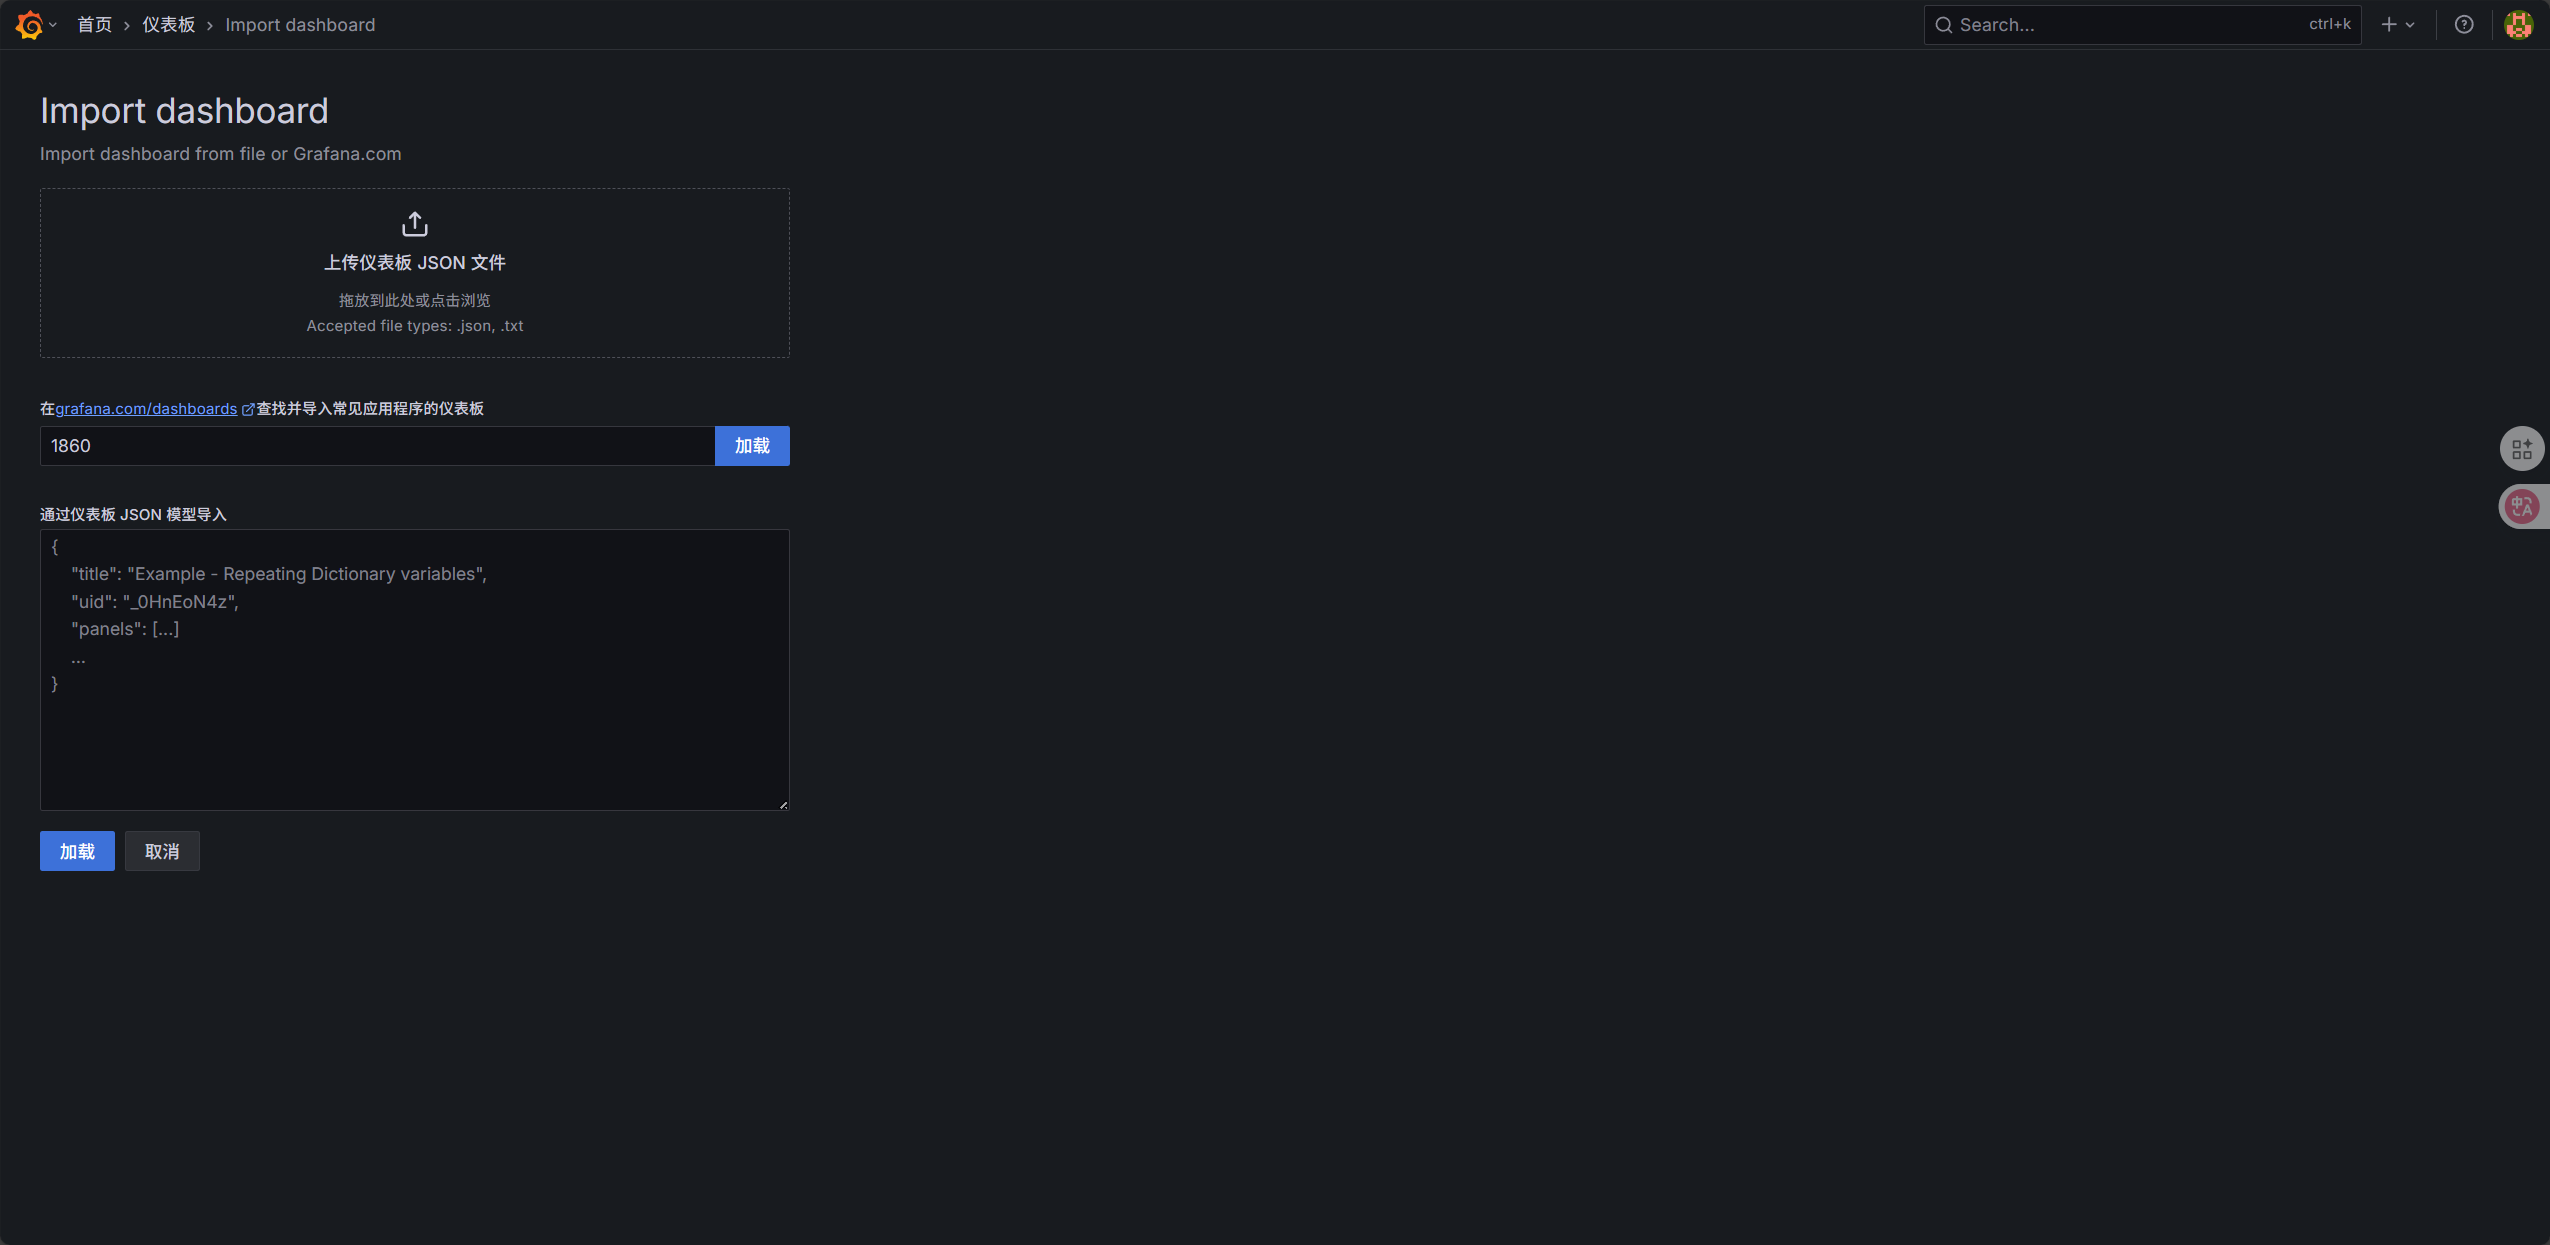
- 选择刚才配置的 Prometheus 数据源,然后点击 “Import”。
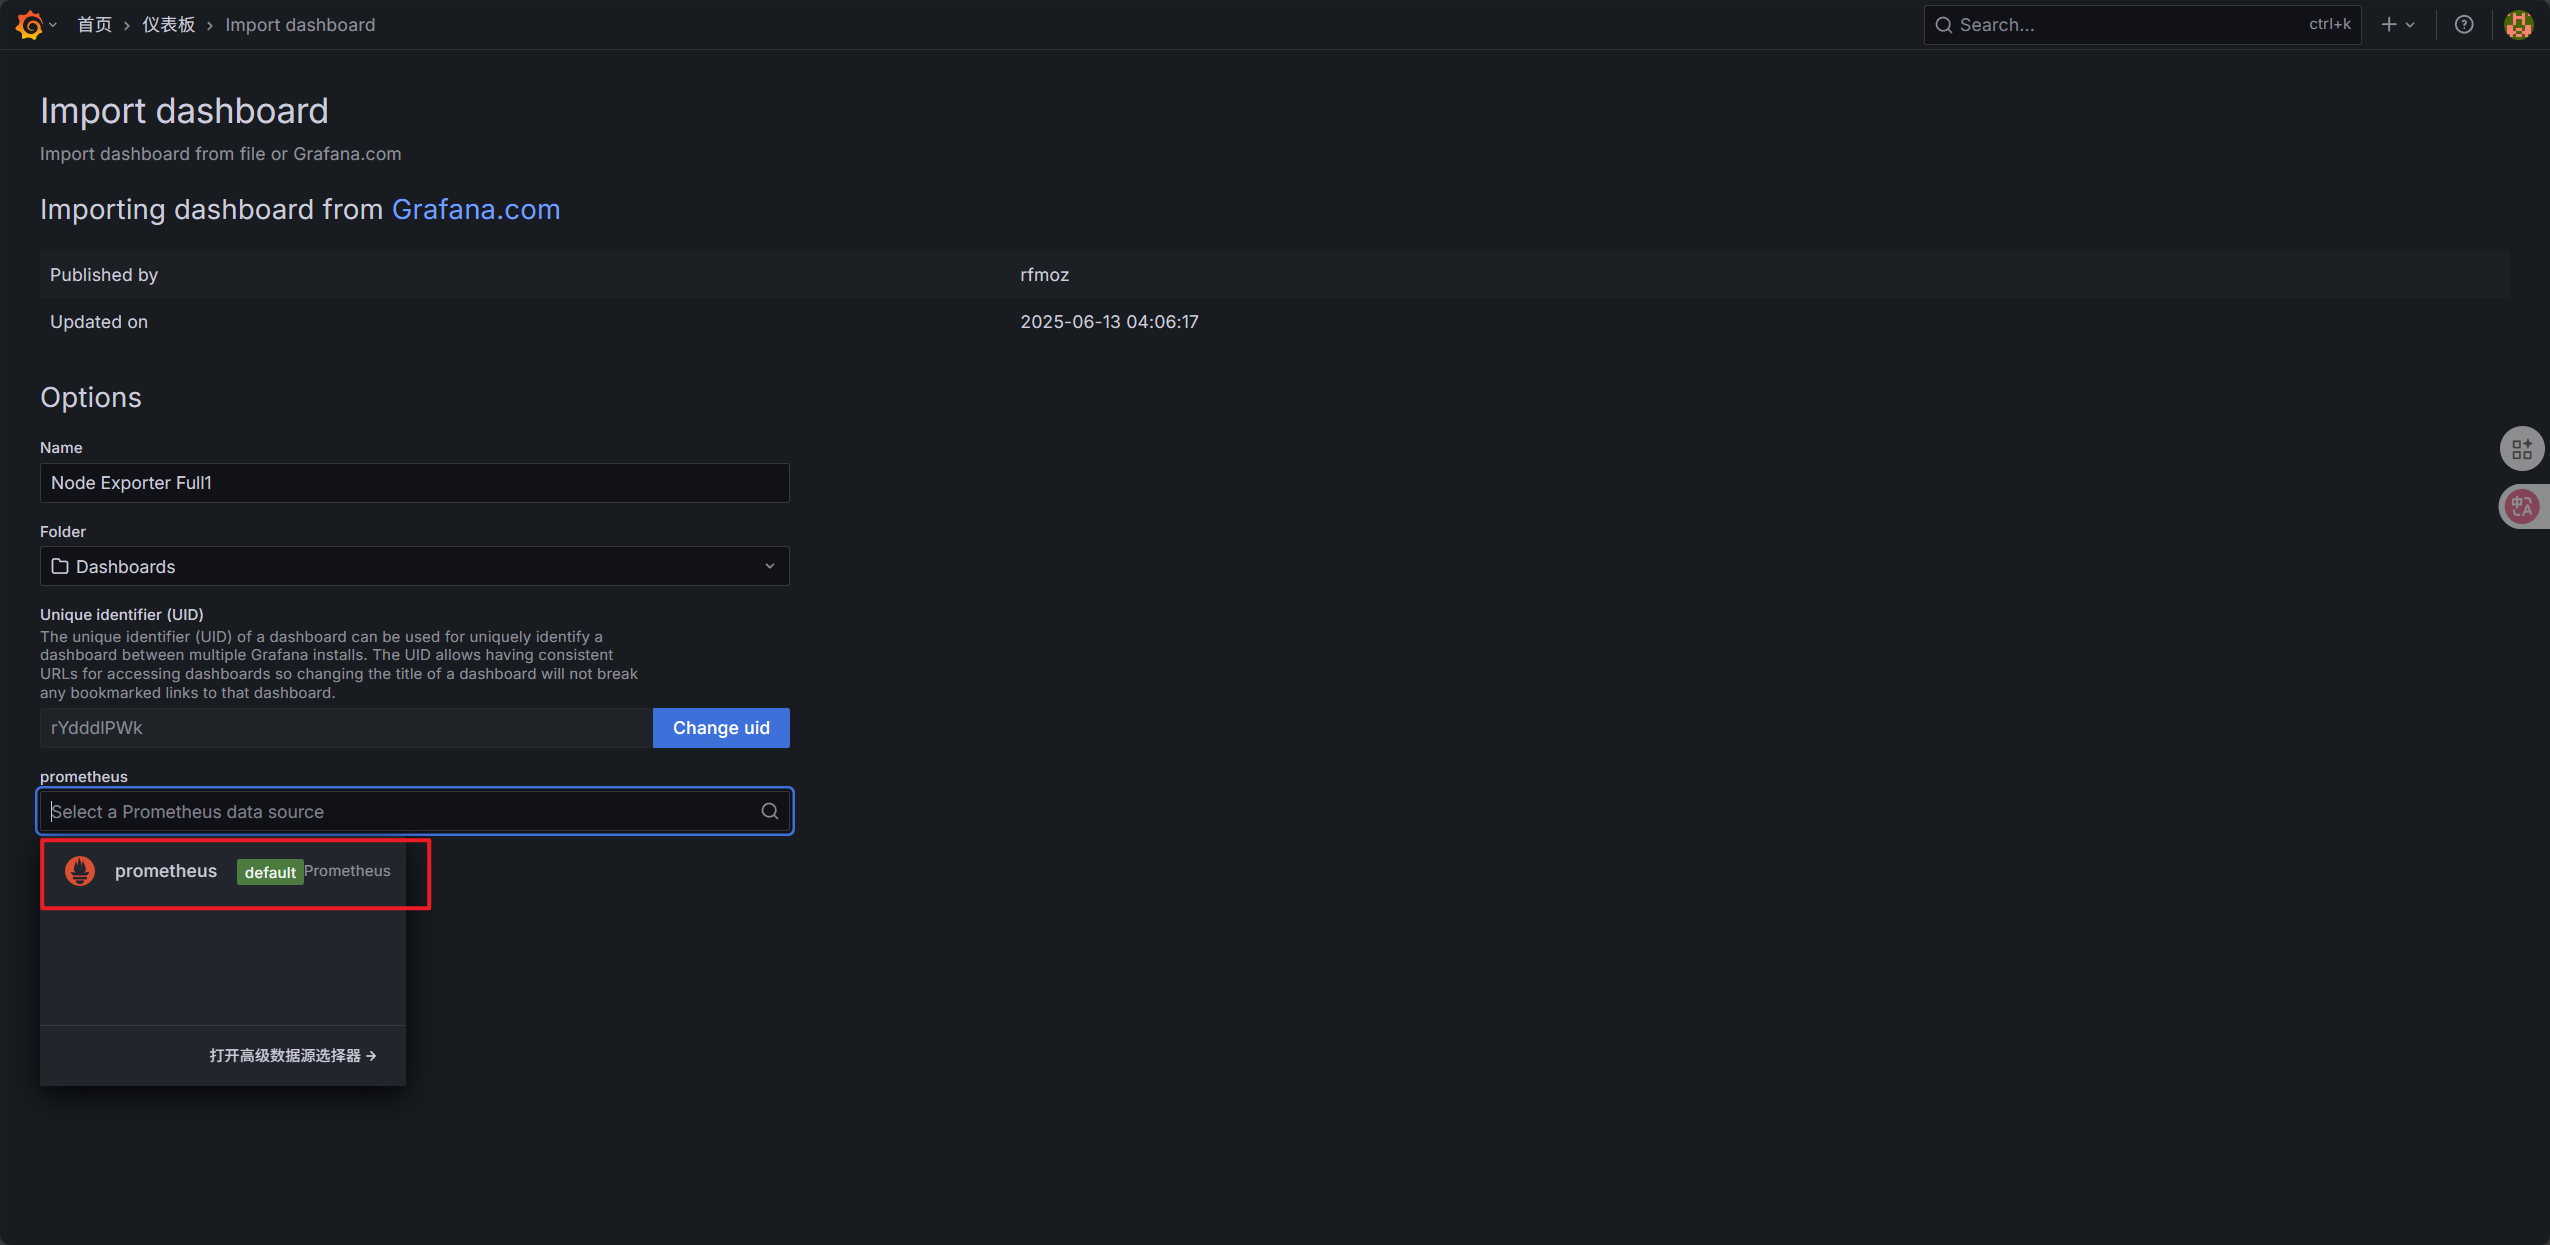
- 现在你可以在仪表板中看到 Node Exporter 的各种指标了。
结语
通过本教程,你应该能够成功部署 Prometheus、Node Exporter 和 Grafana,并将它们连接在一起以监控你的系统性能。你可以根据自己的需求进一步定制仪表板和告警规则,以便更好地满足你的监控需求。